Chapter 3 Data transformation
As mentioned in the introduction, for each sample or “user” many variables were sampled over the course of two days. These measurements are organized into 7 different files and in this section we will focus on how we transformed the data in each of the files for analysis.
We worked on all the datetime columns and transformed them into the format YYYY-MM-DD HH:MM:SS for convenience. We decided to not include RR.csv in our discussion, since the heartbeat information is also included in the actigraph.csv.
3.1 Sleep
The sleep file includes measurements like the time the user gets into bed to total minutes spent in bed, total sleep time, number of times the user wakes up etc.
Every user once in bed (to sleep) doesn’t get out of bed till morning except one. Sleep records of user 1 showed that he got out of bed at 3:31 AM and went back to sleep at 3:57 AM. For simplification, we treated the time interval that the user was out of bed as an “awakening” i.e. when a user awaken from his sleep and remains awake for some time. This required updating the rest of the variables and depending on the definition , we either took the average or maximum or summed the two quantities corresponding to each of the “sleep sessions”. For example, “Total Sleep Time” was now the sum of the sleep time in both sessions, while “Sleep Fragmentation Index” was averaged across sessions.
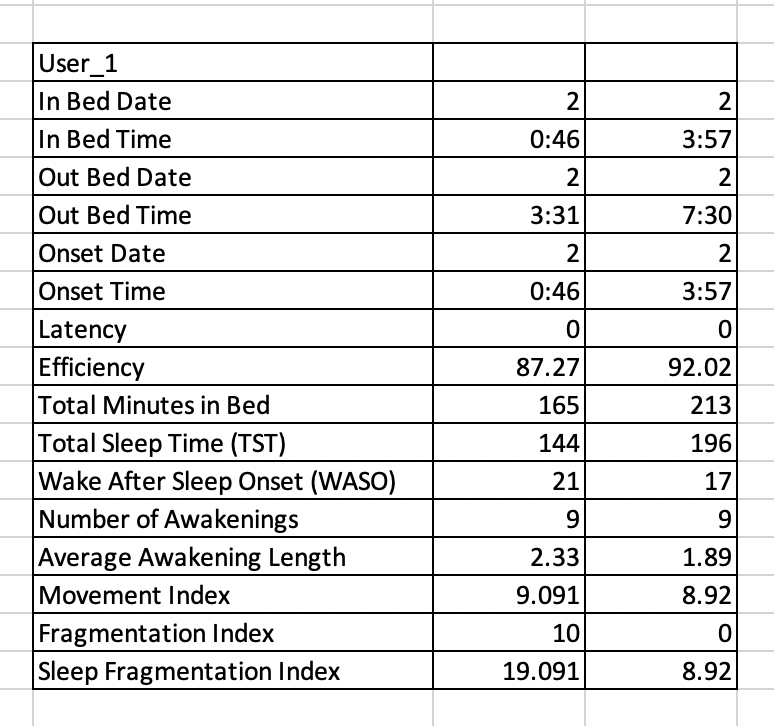
Sleep Measurements of User 1
3.2 Actigraph
Actigraph.csv contained accelerometer and inclinometer data recorded throughout the day. Overall, it tracked users’ movement data, such as steps, direction, acceleration, positions, etc.
We transformed the data as follows -
- Datetime format: We transform the
timecolumn into datetime type in R. Also, since initialtimecolumn doesn’t contain date information, we add days according to thedaycolumn to create a relative time stamp for each record in order to facilitate future calculation. - Create category
Position: Here we gathered columns with inclinometer information, which wereInclinometer.Off,Inclinometer.Standing,Inclinometer.Sitting,Inclinometer.Lying, transformed them into categorical columnPosition. By doing so, we can explore data correlations under groups of position throughout the day.
3.3 Activity
This file contained information on 13 different categories of activities measured throughout the day and the time (of event happening) recorded.
We transformed the data as follows -
- Datetime format: Here we substitute “00:00” to “24:00” in column
Endto avoid calculating between wrong dates, and then transformed into the format as we did forActigraph.csv. - Relabel the activities: The document labeled the activity categories from 1 to 12. However, an extra category, labeled as
0, also included in the dataset. In this project, we will assume that the0represented undetermined activities. Here, we also had to deal with several minor mistakes in the dataset manually. - Calculate duration for each activity: To figure the total time each user spent on each activity, we calculate time intervals (
End-Start) between different activities in seconds.
3.4 Saliva
Saliva.csv collected Melatonin and Cortisol concentrations in the saliva for each participants before going to bed and after waking up. From each of the two samples, the concentration of cortisol and melatonin were calculated. Melatonin levels are reported in μg per μg of protein while cortisol levels are reported in μg per 100 μg of protein. The data contains the normalized concentrations of both hormones and so no transformation or normalization was needed to use this data.
3.5 User info
This file contains anthropocentric characteristics of the participant which include the gender, height in centimeters, weight in kgs and age in years. The data is pretty standard and did not require any sort of transformation